Linear Algebra(4) - Clustering
2021. 1. 30. 10:23ㆍ[AI]/Data Science Fundamentals
<Learned Stuff>
key points
- supervised / unsupervised
- screeplot
개념
- k-means clustering
<New Stuff>
[Supervised / Unsupervised]
Supervised : training data에 label이 있을 경우
- Classification : 주어진 데이터의 카테고리 or 클래스 예측
- Prediction : continuous data를 바탕으로 결과 예측
Unsupervised : training data에 label이 없는 경우
- Clustering : 연관된 feature을 바탕으로 유사한 그룹을 생성
- Dimensionality Reduction : feature selection/extraction 을 활용해 차원 축소
- Association Rule Learning : feature들의 관계를 발견하는 방법
[Screeplot]
principal components vs % of explained variance ratio

[K-means Clustering]
목적 : 주어진 데이터들이 얼마나 + 어떻게 유사한 지 알아보는 것
종류
- Hierarchical
- Point Assignment
- Hard vs Soft
How
- k 개의 random sample을 cluster의 중심점으로 할당
- 설정한 중심점에서 가장 가까운 데이터를 찾는다 (argmin)
- 그 데이터를 cluster의 새로운 중심점으로 보고 2~3 과정 반복 (유의미한 변화가 없을때까지 반복)
Code (Hard Version)
from sklearn.datasets import make_blobs
from scipy.spatial import distance
from sklearn.preprocessing import MinMaxScaler

# 직접 해보기

# 0. sample 만들기
x, y = make_blobs(n_samples = 1000, centers = 3, n_features = 2,random_state = np.random.seed(28))
# sample 100 개 / 3개 그룹 / feature 2개
# x : feature 1 & 2 에 대한 data (100개씩) / np.array
# y : label

# 1. scaling (normalizer 사용함)
scaled = MinMaxScaler().fit_transform(x)

# 2. random 3 points

# feature 1 & 2 DataFrame으로 만들어주기
df = pd.DataFrame(scaled)

# random하게 3개의 데이터 추출 후 centroid 로 선정
sample_df = df.sample(3)

# 3. kmeans_clustering 함수

# update cluster 담을 DataFrame 생성
empty_label_df = pd.DataFrame()

def kmeans_clustering(df, empty_label_df, centroid, iteration) :

  # 데이터 & centroid 간 거리 계산
  distances = distance.cdist(df.iloc[:,0:2], centroid, 'euclidean')

  # 각 데이터간 centroid와 가장 가까운 index 반환 (label이 된다)
  updated_labels = np.argmin(distances, axis = 1)

   # updated label을 empty_label_df에 추가
  empty_label_df['iteration'+str(iteration)] = updated_labels

   # df에도 추가 / 나중에 drop 시킬 것
  df['iteration' + str(iteration)] = updated_labels

  # 몇번째 iteration 인지 확인
  print("iteration : ", iteration)

  # updated centroids
  updated_centroids_df = df.groupby('iteration'+str(iteration)).mean()

  # df 에는 feature만 담을 것이기 때문에 drop
  df = df.drop('iteration'+str(iteration),axis=1)

  # 현재 iteration column index 반환
  current_col_index = empty_label_df.columns.get_loc('iteration'+str(iteration))

  # 첫번째 column은 전 column과 비교대상이 없으므로 다음 단계로 진입
  if current_col_index == 0 :
    return kmeans_clustering(df,empty_label_df,updated_centroids_df,iteration+1)
  else :

    # 현재 label과 전 label 비교
    convergence = np.array_equal(empty_label_df.iloc[:,current_col_index], empty_label_df.iloc[:,current_col_index-1])

    if convergence == True : # 현재 label이 전 label과 같다면 stop
      return df, iteration, empty_label_df
    else : # 현재 label이 전 labal과 다르다면 다음 단계로 진입
      return kmeans_clustering(df,empty_label_df,updated_centroids_df,iteration+1)

# 실행
df1,iter,empty_label_df1 = kmeans_clustering(df, empty_label_df,sample_df,1)

empty_label_df1 # k : 11번의 iteration 필요하다
Code (Easy Version)
from sklearn.datasets import make_blobs
from sklearn.preprocessing import MinMaxScaler
from sklearn.cluster import KMeans
import matplotlib.pyplot as plt

# sample 만들기
x, y = make_blobs(n_samples = 1000, centers = 3, n_features = 2,random_state = np.random.seed(28)) # sample 100 개 / 3개 그룹 / feature 2개
# x : feature 1 & 2 에 대한 data (100개씩)
# y : label

# scaling (normalizer 사용함)
scaled = MinMaxScaler().fit_transform(x)

# k-means 적용
kmeans = KMeans(n_clusters = 3)
kmeans.fit(scaled)

# labels 반환
kmeans.labels_

# sum of squared distances of samples to their closest cluster center
kmeans.inertia_
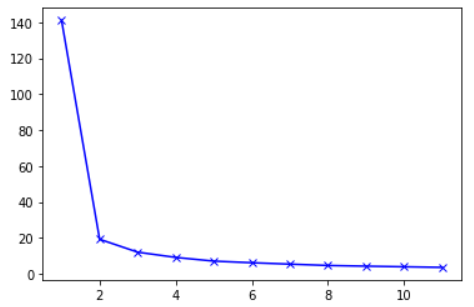
Graph
# sum of squared distances 담을 list 만들기
sum_of_squared_distances = []

# 임의로 지정
K = range(1, 12)

# k에 따른 sum of squared distances 담기
for k in K:
    kmeans = KMeans(n_clusters = k)
    kmeans.fit(scaled)
    sum_of_squared_distances.append(kmeans.inertia_)

# plot
plt.plot(K, sum_of_squared_distances, 'bx-');
[Hierarchical Clustering]
- grouping similar objects into groups called 'clusters'
method
- single
- complete
- average
- weighted
- centroid
- median
- ward
graph (default)
import scipy.cluster.hierarchy as shc

# df 라는 DataFrame 혹은 array 가 있다고 가정
# method : ward 적용

dn = shc.dendrogram(shc.linkage(df,method='ward'))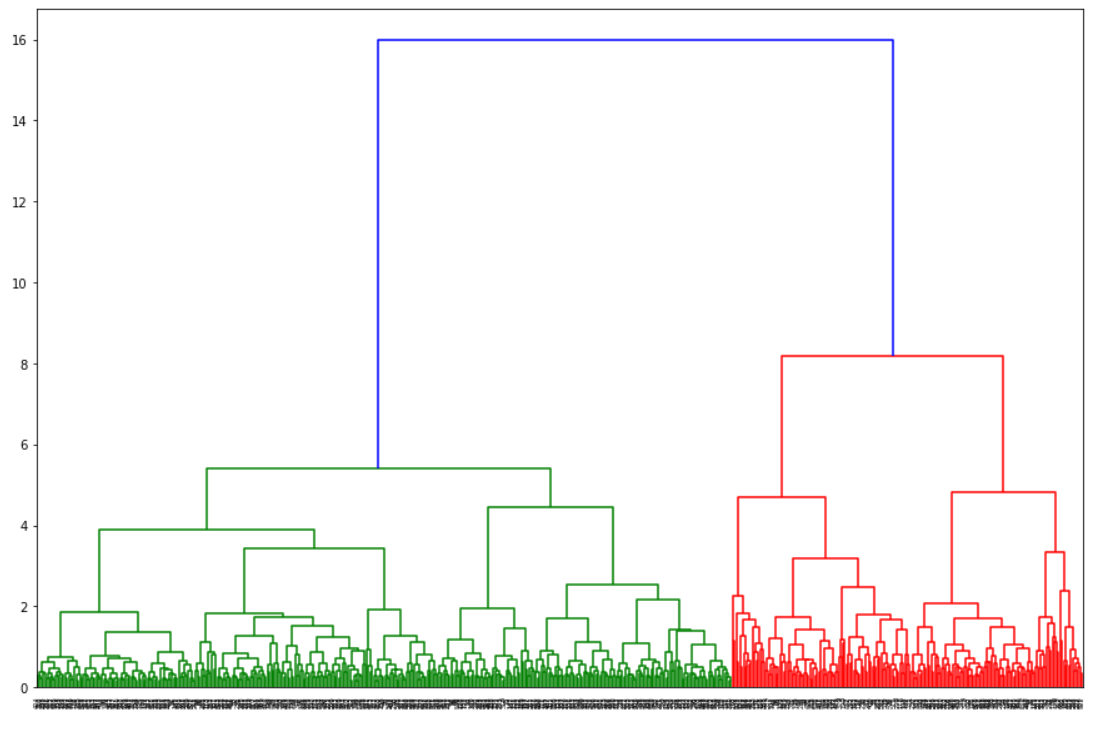
graph (truncate_mode 적용)
import scipy.cluster.hierarchy as shc

# df 라는 DataFrame 혹은 array 가 있다고 가정
# 20개의 small group으로 나누겠다는 의미
# 밑에 있는 숫자들은 small group에 cluster된 총 갯수를 의미 (이들의 총합은 data의 row의 갯수와 같다)

dn = shc.dendrogram(shc.linkage(df,method='ward'),truncate_mode='lastp',p=20) 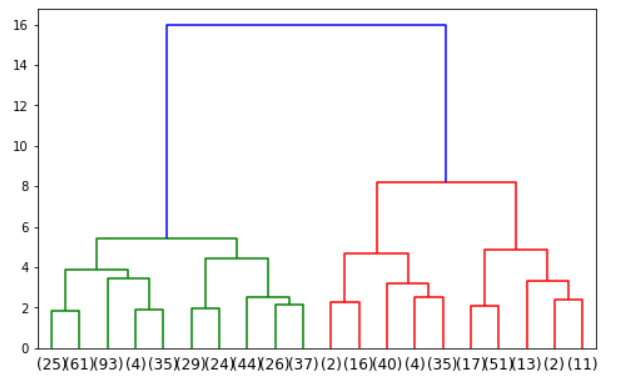
728x90
'[AI] > Data Science Fundamentals' 카테고리의 다른 글
| Statistic(4) - Bayesian (0) | 2021.01.30 |
|---|---|
| [Statistic (Summary)] T-test & $\chi^2$-test (0) | 2021.01.30 |
| Linear Algebra(1) - Vector/Matrix (0) | 2021.01.30 |
| Linear Algebra(2) - Span/Basis/Linear Projection (0) | 2021.01.30 |
| Linear Algebra(3) - Dimension Reduction (0) | 2021.01.30 |